
Related Searches: pandas dataframe, pandas merge, pandas read csv, pandas tutorial, pandas groupby, pandas drop column, pd read_csv, pandas set index, drop column pandas, pandas apply, pandas series
Introduction to Python Pandas
The name “Pandas” has a reference to both “Panel Data”, and “Python Data Analysis” and was created by Wes McKinney in 2008. Pandas is a Python library used to work with data sets. It is popular for its powerful functionalities. Its common and important functionalities include analyzing, cleaning, exploring and manipulating data. In this tutorial we will cover the basic knowledge that you need to start with pandas. We will start with installing and creating different dataframes. Moreover we will also cover how to read different types of files using pandas.
Install Pandas in Python
Standard python distribution does not come with pandas. We have to manually install pandas in our local environment. We can use pip to install python pandas on our local system.
pip install pandas
If you have installed Anaconda Python Packages, pandas will be installed by default with it.
Create Pandas Series
A series is a sequence of data values. Unlike data frame which is a table, a series is a list of data. Creating a panda series is similar to creating a list.See example below.
import pandas as pd

#creating panda series
data = pd.Series([10, 20, 30, 40, 50])

#printing data
print(data)
Output:
0  10
1  20
2  30
3  40
4  50
A series is simply, a single column of data frame. So that means we can assign column values to the Series in the same way as before, using an index parameter. However, a Series does not have a column name, it only has one overall name.
import pandas as pd

#creating series and indexing it
data = pd.Series([30, 35, 40], index=['First year', 'Second year', 'third year Sales'], name='Product per year')

#printing data
print(data)
Output:
First year     30
Second year     35
third year Sales  40
Name: Product per year, dtype: int64
Pandas Dataframe
A data frame is a table which contains an array of individual entries, each of which has a certain value. Each entry corresponds to a row (or record) and a column.
We use pd.DataFrame() constructor to generate Data frame objects. The
syntax for declaring a new data frame is a
dictionary
whose keys are the column names, and values are a list of
entries. This is the standard way of constructing a new Data frame,
see example below.
import pandas as pd

# creating data frame
data = pd.DataFrame({'first': [10, 21], 'second': [11, 2]})

#printing data
print(data)
output:
 first second
0   10   11
1   21    2
Data frames are not only limited to integers and floats. It can also contain strings as well. See the example below.
import pandas as pd

#creating dataframe
data = pd.DataFrame({'intro': ["my name is BA", "Age is 20"], 'age': ["My name is BB", "Age is 22"]})

#printing data
print(data)
Output:
 intro      age
0 my name is BA My name is BB
1   Age is 20   Age is 22
The dictionary-list constructor assigns values to the column labels, but just uses an ascending count from 0 (0, 1, 2, 3, …) for the rows labels. We can change the default one and assign custom row labelling.
The list of row labels used in a Data frame is known as an index. We can assign values to it by using an index parameter in our constructor: see the example below.
import pandas as pd

#creating data frame
data = pd.DataFrame({'one': [30, 40],
'two': [0, 50]},
index=['Product A', 'Product B'])

#printing data
print(data)
Output:
 one two
Product A  30  0
Product B  40  50
Example-1: Indexing and Selecting data in Pandas
As we have seen above, a Data frame is a two-dimensional data structure. For example, data is aligned in a tabular fashion in rows and columns. Pandas allows us to perform basic operations on rows and columns like selecting, deleting, adding, and renaming. In this section we will perform some basic operations on rows and columns using pandas on a data frame.
Let say we have the following pandas data frame:
import pandas as pd

# creating dataframe along with indexing
data = pd.DataFrame({'students': [300, 450, 500, 450, 500], 'teachers': [11, 14, 14, 13, 15], 'departments':[2, 3, 3, 3, 4]},
index=["2016", "2017", "2018","2019","2020"])

# printing data
print(data)
Output:
 Students teachers departments
2016    300    11      2
2017    450    14      3
2018    500    14      3
2019    450    13      3
2020    500    15      4
Example-2: Selecting column in pandas
Selecting a particular column in pandas data frame is very easy. We can select a column by simply calling its name.See the following example.
import pandas as pd

#creating data frame
data = pd.DataFrame({'students': [300, 450, 500, 450, 500], 'teachers': [11, 14, 14, 13, 15], 'departments':[2, 3, 3, 3, 4]},
index=["2016", "2017", "2018","2019","2020"])

<i># select one column columns</i>
print(data[['students']])
Output:
   students

2016    300
2017    450
2018    500
2019    450
2020    500
We can also select multiple columns at time. See the example below:
import pandas as pd

#creating dataframe
data = pd.DataFrame({'students': [300, 450, 500, 450, 500], 'teachers': [11, 14, 14, 13, 15], 'departments':[2, 3, 3, 3, 4]},
index=["2016", "2017", "2018","2019","2020"])

 #Selecting two columns
 print(data[['students', 'teachers']])
Output:
 students teachers
2016    300    11
2017    450    14
2018    500    14
2019    450    13
2020    500    15
Example-3: Adding new column in Pandas
We can create a new list as a column and then add that list to the existing data frame.Let’s add one more column to our data frame. See the example below:
import pandas as pd

<i># creating data frame</i>
data = pd.DataFrame({'students': [300, 450, 500, 450, 500], 'teachers': [11, 14, 14, 13, 15], 'departments':[2, 3, 3, 3, 4]},
index=["2016", "2017", "2018","2019","2020"])

<i># creating new list as dataframe</i>
cities = ["x", "Y", "z", "A", "B"]

<i># adding new column to data frame</i>
data["City"]= cities

<i># Printing dataframe</i>
print(data)
Output:
 students teachers departments City
2016    300    11      2  x
2017    450    14      3  Y
2018    500    14      3  z
2019    450    13      3  A
2020    500    15      4  B
There is a built-in function in pandas known as .insert() which is
used to add a new column to the existing data frame. The first argument
in .insert() is to define the position of inserting a new column, the
second argument is the name of the column and the third argument
contains the data/entries. See the example below.
import pandas as pd

<i># creating data frame</i>
data = pd.DataFrame({'students': [300, 450, 500, 450, 500], 'teachers': [11, 14, 14, 13, 15], 'departments':[2, 3, 3, 3, 4]},
index=["2016", "2017", "2018","2019","2020"])

<i># inserting new column to datafram</i>
<i>#defining position at o index</i>

data.insert(0, "city" , ["x", "Y", "z", "A", "B"] )

<i># Printing dataframe</i>
print(data)
Output:
 city students teachers departments
2016  x    300    11      2
2017  Y    450    14      3
2018  z    500    14      3
2019  A    450    13      3
2020  B    500    15      4
Example-4: Deleting column in Pandas
Column can be deleted in pandas by using its built-in function known as
drop(). Rows or columns can be removed using index labels or column
names using this method. See the example below.
import pandas as pd

<i># creating data frame</i>
data = pd.DataFrame({'students': [300, 450, 500, 450, 500], 'teachers': [11, 14, 14, 13, 15], 'departments':[2, 3, 3, 3, 4]},
index=["2016", "2017", "2018","2019","2020"])

<i># Deleting column named teachers</i>
data.drop(['students'], axis=1, inplace=True)

<i># Printing dataframe</i>
print(data)
Output:
 teachers departments
2016    11      2
2017    14      3
2018    14      3
2019    13      3
2020    15      4
The Pandas drop() function can take the following arguments:
labels: String or list of strings referring to row or column name.axis: int or string value, 0 ‘index’ for Rows and 1 ‘columns’ for Columns.indexorcolumns: Single label or list. index or columns are an alternative to axis and cannot be used together.level: Used to specify level in case a data frame is having multiple level indexes.inplace: Makes changes in the original Data Frame if True.errors: Ignores error if any value from the list doesn’t exists and drops rest of the values when errors = ‘ignore’
Example-5: Selecting row in Pandas
Pandas provide a unique method to retrieve rows from a Data frame.
dataframe.loc() is a pandas built-in function used to select rows from
pandas data frame. Rows can also be selected by passing integer location
to an loc() function. See the example below.
import pandas as pd

<i># creating data frame</i>
data = pd.DataFrame({'students': [300, 450, 500, 450, 500], 'teachers': [11, 14, 14, 13, 15], 'departments':[2, 3, 3, 3, 4]},
index=["2016", "2017", "2018","2019","2020"])

<i># Selecting specific row</i>
row = data.loc["2018"]

<i># Printing selected row</i>
print(row)
Output:
students    500
teachers    14
departments   3
Name: 2018, dtype: int64
Example-6: Adding new row in Pandas
In pandas, in order to add a new row, we can concat the old data frame
with the new one. See the example below:
import pandas as pd

<i># creating data frame</i>
data = pd.DataFrame({'students': [300, 450, 500, 450, 500], 'teachers': [11, 14, 14, 13, 15], 'departments':[2, 3, 3, 3, 4]},
index=["2016", "2017", "2018","2019","2020"])

<i>#Creating new row as dataframe</i>
new_row = pd.DataFrame({'students' :100, 'teachers': 9, 'departments':2}, index=[0])

<i># concatinating new dataframe with old one at position 0</i>
data = pd.concat([new_row, data]).reset_index(drop = True)

<i># printing the data</i>
print(data)
Output:
 students teachers departments
0    100     9      2
1    300    11      2
2    450    14      3
3    500    14      3
4    450    13      3
5    500    15      4
Example-7: Deleting a row in Pandas
Pandas have a built-in function drop() to delete rows. Rows are
deleted by dropping Rows by index label. See the example below.
import pandas as pd

<i># creating data frame</i>
data = pd.DataFrame({'students': [300, 450, 500, 450, 500], 'teachers': [11, 14, 14, 13, 15], 'departments':[2, 3, 3, 3, 4]},
index=["2016", "2017", "2018","2019","2020"])

<i># deleting 2016 row</i>
data.drop('2016', inplace=True)

<i># printing the data</i>
print(data)
Output:
 students teachers departments
2017    450    14      3
2018    500    14      3
2019    450    13      3
2020    500    15      4
Working with CSV files in Pandas
We will not always work with data frames and series that we created, but sometimes we need to work with already existing data as well. Data can be stored in many different forms and formats among which CSV is a popular one. In this section we will see how we can use pandas to perform different operations on CSV files.
Example-1: Save pandas data frame as CSV file
Most of the datasets we work with are called Data frames. Pandas had a powerful feature to convert data frame to CSV file and use it later.
Let us now save our data frame to a CSV file using pandas.
import pandas as pd

<i># creating data frame</i>
data = pd.DataFrame({'students': [300, 450, 500, 450, 500], 'teachers': [11, 14, 14, 13, 15], 'departments':[2, 3, 3, 3, 4]},
index=["2016", "2017", "2018","2019","2020"])

<i># converting dataframe to csv file</i>
data.to_csv("My_file.csv")
Here is newly created CSV file.
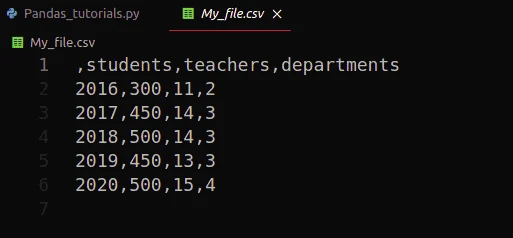
Notice that the index and headers are also included in our CSV file. We can convert our data frame to CSV without headers and indexes. See the example below:
import pandas as pd
from pandas.core.indexes.base import Index
<i># creating data frame</i>
data = pd.DataFrame({'students': [300, 450, 500, 450, 500], 'teachers': [11, 14, 14, 13, 15], 'departments':[2, 3, 3, 3, 4]},
index=["2016", "2017", "2018","2019","2020"])
<i># converting dataframe to csv file</i>
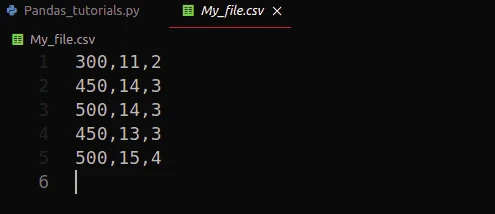
data.to_csv("My_file.csv" , header= False, index=False)
Output:
Example-2: Reading CSV files using Pandas
Pandas is known for its powerful built-in functions. read_csv() is a
built-in function which is used to
read csv
files.See example below:
import pandas as pd

<i># reading csv file</i>
data = pd.read_csv("My_file.csv")

<i># printing data</i>
print(data)
Output:
 300 11 2
0 450 14 3
1 500 14 3
2 450 13 3
3 500 15 4
Here, notice that the row indexing starts from the second row, it is because by default pandas treats the very first column as headers and starts indexing from the next row.See the example below where we had defined headers to None.
import pandas as pd

<i># reading csv file</i>
data = pd.read_csv("My_file.csv", header=None)

<i># printing data</i>
print(data)
Output:
 0  1 2
0 300 11 2
1 450 14 3
2 500 14 3
3 450 13 3
4 500 15 4
Working with xlsx files in Pandas
We can easily read xlsx files using pandas and apply the powerful
features of pandas over it.Pandas reads the xlsx files and stores data
in the pandas data frame. Function .read_xlsx() is used to read xlsx
files. See the example below.
Let us say the xlsx file contains the following data:
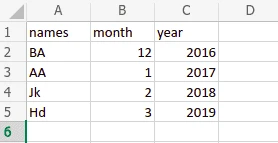
import pandas as pd

<i># reading excel file</i>
<i># storing data in pandas dataframe</i>
df = pd.read_excel ('My_excel.xlsx')
print (df)
Output:
 names month year
0  BA   12 2016
1  AA   1 2017
2  Jk   2 2018
3  Hd   3 2019
If your excel file has more than one sheet, we can print individual and
specified sheet by passing sheet_name argument:
import pandas as pd

<i># reading excel file</i>
<i># storing data in pandas dataframe</i>
df = pd.read_excel ('My_excel.xlsx', sheet_name="Sheet1")

print (df)
Output:
 names month year
0  BA   12 2016
1  AA   1 2017
2  Jk   2 2018
3  Hd   3 2019
Summary
Pandas is a python module used to work with data sets. Its main functions include analyzing, cleaning, exploring, and manipulating data. Moreover, it allows us to analyze big data and make conclusions based on statistical theories, clean messy data sets, and make them readable and relevant. That’s why it is one of the most important components in data science. In this tutorial we discussed some of the basic and important concepts of pandas including selecting and indexing data frame and reading different types of files containing data sets.
