
Related searches: Linux Disk Usage. Top Storage monitoring tools. How to monitor Disk IO performance with examples. How to check disk read write usage on Linux. Check and monitor disk IO statistics and disk stats in Linux using iostat, vmstat and other tools. How to monitor disk IO by process ID for specific process in Linux. Storage monitoring tools. Get disk read write operation details in Linux with examples.

In my earlier article I gave you an overview of different disk types (HDD, SSD, Optical Disks) and disk interface types (SATA, IDE, SAS, SCSI..) in details with pros and cons. Now in this article I will show you various tools along with examples to monitor disk IO performance in Linux environment.
I am running a dummy process to perform some read and write operations using while as shown below, dd command and stress tool.
# while true; do cp loadfile loadfile1; done
1. iostat - Report Disk IO Statistics
isotat is part of sysstat rpm. You can install sysstat using yum
or any other tool depending upon your environment.
# rpm -q sysstat
sysstat-10.1.5-17.el7.x86_64
iostat summarises per-disk I/O statistics, providing metrics for IOPS,
throughput, I/O request times, and utilization. It can be executed by
any user, and is typically the first command used to monitor disk
io performance and investigate disk IO statistics and issues at the
command line.
iostat provides many options for customizing the output. A useful
combination is -dxz 1, to show disk utilization only (-d), extended
columns (-x), skipping devices with zero metrics (-z), and
per-second output.
# iostat -dxz 1
Linux 3.10.0-1062.9.1.el7.x86_64 (rhel-fews-cc)         01/07/2020      _x86_64_        (32 CPU)

Device:         rrqm/s   wrqm/s     r/s     w/s    rkB/s    wkB/s avgrq-sz avgqu-sz   await r_await w_await  svctm  %util
sda               0.28     1.35    2.34    8.52    36.45   510.13   100.68     0.06    5.36    3.79    5.79   0.17   0.18
dm-0              0.00     0.00    0.95    0.06     3.81     0.23     8.00     0.00    2.10    1.60   10.66   0.62   0.06
dm-1              0.00     0.00    1.65    9.81    30.58   509.90    94.31     0.06    5.32    6.07    5.19   0.12   0.14
dm-2              0.00     0.00    1.65    9.81    30.58   509.90    94.31     0.06    5.32    6.07    5.19   0.12   0.14
dm-3              0.00     0.00    1.65    9.80    30.63   508.68    94.17    10.69  933.11   12.15 1088.51   0.16   0.18
These columns summarize the workload applied. You can check iostat man page to understand the meaning of each column.
2. vmstat - Report virtual memory statistics
vmstat is another monitoring tool which is part of procps-ng rpm. It
is most likely possible that procps-ng is installed by default on your
Linux node or else you can also install it manually using yum
# rpm -q procps-ng
procps-ng-3.3.10-23.el7.x86_64
vmstat reports information about processes, memory, paging, block IO,
traps, disks and cpu activity. Here we will use vmstat to monitor disk
IO performance in Linux using -d for 1 second with 1 second interval.
# vmstat -d 1 1
disk- ------------reads------------ ------------writes----------- -----IO------
       total merged sectors      ms  total merged sectors      ms    cur    sec
sda   667530  12447 7660380 2108711 91090178 3458386 12047478760 1506891675      0  11791
dm-0  607338      0 4858728 1760585 206130      0 1649040 5723571      0   1245
dm-1   72135      0 2626562  466444 94344918      0 12045847864 1574232872      0  11050
dm-2   72135      0 2626562  466583 94344918      0 12045847864 1574410699      0  11050
dm-3   72240      0 2630178  905647 94422613      0 12046752440 3064011073      9  12087
dm-4       0      0       0       0      0      0       0       0      0      0
To get summary disk IO statistics about disk activity
# vmstat -D 1 1
            6 disks
            3 partitions
      1492064 total reads
        12447 merged reads
     20407898 read sectors
      5711511 milli reading
    374572389 writes
      3460667 merged writes
  48208708608 written sectors
   7759736862 milli writing
            0 inprogress IO
        47247 milli spent IO
Follow man page of vmstat to get the complete list of supported
arguments using which you can monitor your system resource.
3. iotop - Monitor disk IO Speed
iotop specialises in getting disk stats and is part of iotop rpm.
You can install iotop using yum or any other tool depending upon
your environment.
# rpm -q iotop
iotop-0.6-4.el7.noarch
iotop watches disk I/O usage information output by the Linux kernel
(requires 2.6.20 or later) and displays a table of current I/O usage by
processes or threads on the system.
With --only iotop will only show processes or threads actually doing
I/O, instead of showing all processes or threads so you can check and
monitor disk IO performance.
# iotop --only
Total DISK READ :       0.00 B/s | Total DISK WRITE :    1103.25 M/s
Actual DISK READ:       0.00 B/s | Actual DISK WRITE:     699.93 K/s
  TID  PRIO  USER     DISK READ  DISK WRITE  SWAPIN     IO>    COMMAND
15091 be/4 root        0.00 B/s  965.33 M/s  0.00 % 99.99 % cp loadfile loadfile1
29926 be/4 root        0.00 B/s    0.00 B/s  0.00 % 15.49 % [kworker/u64:0]
 3312 be/3 root        0.00 B/s  137.92 M/s  0.00 %  0.09 % [jbd2/dm-3-]
4. nmon - Monitor System Stats
nmon is not available in the default repository of RHEL/CentOS. You
can install if from the EPEL repository. To install the entire EPEL
repo on RHEL/CentOS 7
# rpm -Uvh https://dl.fedoraproject.org/pub/epel/epel-release-latest-7.noarch.rpm
and to install EPEL repo on CentOS/RHEL 8
# rpm -Uvh https://dl.fedoraproject.org/pub/epel/epel-release-latest-8.noarch.rpm
Next you can install nmon using yum command
# yum install nmon
Alternatively you can also install nmon tool manually
# rpm -Uvh https://dl.fedoraproject.org/pub/epel/7/x86_64/Packages/n/nmon-16g-3.el7.x86_64.rpm
nmon can display the CPU, memory, network, disks (mini graphs or
numbers), file systems, NFS, top processes, resources (Linux version &
processors) and on Power micro-partition information.
Execute nmon from the terminal
# nmon
To only display disk usage statistics press D
┌nmon─16g─────────────────────Hostname=rhel-fews-cc─Refresh= 2secs ───18:29.30──────────┐
│ Disk I/O ──/proc/diskstats────mostly in KB/s─────Warning:contains duplicates──────────│
│DiskName Busy    Read    Write       Xfers   Size  Peak%  Peak=R+W    InFlight         │
│sda       61%     62.0 240088.7KB/s 3712.48 64.7KB  580% 3316396.1KB/s148              │
│sda1       0%      0.0      0.0KB/s    0.0   0.0KB    0%       0.0KB/s  0              │
│sda2       0%      0.0      0.0KB/s    0.0   0.0KB    0%       0.0KB/s  0              │
│sda3      61%     62.0 240088.7KB/s 3712.48 64.7KB  580% 3316396.1KB/s148              │
│dm-0       0%     62.0      0.0KB/s   15.5   4.0KB   58%    1559.6KB/s  0              │
│dm-1      61%      0.0 242871.9KB/s 3794.90 64.0KB  580% 3314548.6KB/s218              │
│dm-2      61%      0.0 242871.9KB/s 3794.90 64.0KB  580% 3314548.6KB/s218              │
│dm-3      61%      0.0  14779.6KB/s  230.92 64.0KB  580% 3145026.3KB/s2181             │
│Totals Read-MB/s=0.2      Writes-MB/s=957.7    Transfers/sec=15261.0                   │
└───────────────────────────────────────────────────────────────────────────────────────┘
To display disk usage statistics with graph press d
┌nmon─16g──────[H for help]───Hostname=rhel-fews-cc─Refresh= 2secs ───18:25.12──────────┐
│ Disk I/O ──/proc/diskstats────mostly in KB/s─────Warning:contains duplicates──────────│
│DiskName Busy  Read WriteMB|0          |25         |50          |75       100|         │
│sda       60%    0.4  563.8|RWWWWWWWWWWWWWWWWWWWWWWWWWWWW>                   |         │
│sda1       0%    0.0    0.0|>                                                |         │
│sda2       0%    0.0    0.0|>                                                |         │
│sda3      59%    0.4  563.8|RWWWWWWWWWWWWWWWWWWWWWWWWWWWW>                   |         │
│dm-0      22%    0.4    0.0|RRRRRRRRRRR>                                     |         │
│dm-1      41%    0.0  568.0|WWWWWWWWWWWWWWWWWWWW>                            |         │
│dm-2      41%    0.0  568.0|WWWWWWWWWWWWWWWWWWWW>                            |         │
│dm-3      60%    0.0  511.9|WWWWWWWWWWWWWWWWWWWWWWWWWWWWW>                   |         │
│Totals Read-MB/s=1.1      Writes-MB/s=2775.4   Transfers/sec=44468.8                   │
└───────────────────────────────────────────────────────────────────────────────────────┘
5. atop - Advanced System & Process Monitor
You can again install atop using yum (assuming you had installed EPEL repo) or
alternatively you can manually install atop to check and monitor disk
IO performance in Linux.
# rpm -Uvh https://dl.fedoraproject.org/pub/epel/7/x86_64/Packages/a/atop-2.4.0-4.el7.x86_64.rpm
The program atop is an interactive monitor to view the load on a Linux
system. You can use atop to monitor disk IO by process. It shows the
occupation of the most critical hardware resources (from a performance
point of view) on system level, i.e. cpu, memory, disk and network.
# atop
Now press shift + d for disk activity
Then press c for full command name..
PRC |  sys    6.08s |  user   0.05s  | #proc    398  |  #tslpu     1 |  #zombie    0  | #exit      4  |
CPU |  sys      54% |  user      1%  | irq       6%  |  idle   3026% |  wait    114%  | ipc     0.80  |
CPL |  avg1    0.99 |  avg5   43.05  | avg15 866.47  |  csw   122763 |  intr   90675  | numcpu    32  |
MEM |  tot   125.8G |  free  105.4G  | cache  17.8G  |  buff  230.0M |  slab  938.9M  | hptot   0.0M  |
SWP |  tot     3.7G |  free    3.7G  |               |               |  vmcom   2.7G  | vmlim  66.6G  |
LVM |     rhel-root |  busy     69%  | read       0  |  write  65586 |  MBw/s  409.6  | avio 0.10 ms  |
LVM |  pool00_tdata |  busy     66%  | read       0  |  write  63780 |  MBw/s  398.3  | avio 0.10 ms  |
LVM |  pool00-tpool |  busy     66%  | read       0  |  write  63780 |  MBw/s  398.3  | avio 0.10 ms  |
LVM |  pool00_tmeta |  busy      9%  | read     494  |  write      0 |  MBw/s    0.0  | avio 1.87 ms  |
DSK |           sda |  busy     69%  | read     494  |  write  61302 |  MBw/s  398.5  | avio 0.11 ms  |
NET |  transport    |  tcpi       3  | tcpo       2  |  udpi       0 |  udpo       0  | tcpao      0  |

  PID   TID S  DSK COMMAND-LINE (horizontal scroll with <- and -> keys)                             1/4
12652     - S  76% -bash
 3312     - S  24% jbd2/dm-3-8
27272     - S   0% kworker/u64:3
16016     - D   0% kworker/u64:1
29926     - S   0% kworker/u64:0
16287     - E   0% cp
16290     - E   0% cp
6. collectl - Collects data that describes the current system status
collectl is not available in the internal repo of CentOS/RHEL, so
either you can install EPEL repo itself and then use yum to install
collectl or manually install it.
# rpm -Uvh https://dl.fedoraproject.org/pub/epel/7/x86_64/Packages/c/collectl-4.3.0-5.el7.noarch.rpm
collectl will collect data that describes the current system status.
We can use collectl to check and monitor disk IO performance in Linux.
The following command reports CPU and disk IO statistics. Here c and d
represent CPU and Disk.
# collectl -scd
waiting for 1 second sample...
#<----CPU[HYPER]-----><----------Disks----------->
#cpu sys inter  ctxsw KBRead  Reads KBWrit Writes
   0   0  7406   3895     92     23 342208   5347
   3   3  2616   2540     20      5  98436    657
   0   0  8802   3496    272     68 516096   8064
   0   0  1174    620     36      9  65536   1024
   2   2  7302   3290    184     46 368640   5760
   2   2 17221   6692    500    125 962688  14885
Follow man page of collectl to see all the supported options.
7. sar - Monitor Disk IO Performance
sar is another famous and widely used too and is part of sysstat
rpm. You can install sysstat using yum or any other tool depending
upon your environment.
# rpm -q sysstat
sysstat-10.1.5-17.el7.x86_64
sar is a powerful tool which can be used to monitor all the system
resources. But to stick to this article’s topic, we will use -d to
monitor disk IO
performance for 1 second with an interval of 1 second.
# sar -d 1 1
Linux 3.10.0-1062.9.1.el7.x86_64 (rhel-fews-cc)         01/07/2020      _x86_64_        (32 CPU)

06:43:44 PM       DEV       tps  rd_sec/s  wr_sec/s  avgrq-sz  avgqu-sz     await     svctm     %util
06:43:45 PM    dev8-0   6274.00    400.00 796672.00    127.04    142.20     22.64      0.16    100.00
06:43:45 PM  dev253-0     50.00    400.00      0.00      8.00      0.00      0.08      0.08      0.40
06:43:45 PM  dev253-1   6225.00      0.00 796800.00    128.00    143.10     22.96      0.16    100.00
06:43:45 PM  dev253-2   6225.00      0.00 796800.00    128.00    143.11     22.96      0.16    100.00
06:43:45 PM  dev253-3      0.00      0.00      0.00      0.00   4285.03      0.00      0.00    100.00
You can check this
article to understand
about all these columns
and other options supported with sar and ksar.
8. blktrace - generate traces of the Disk I/O
blktrace is part of blktrace rpm which should be available in your
default repository. You can install it using yum command or other
tools based on your environment.
# rpm -qa | grep blktrace
blktrace-1.0.5-8.el7.x86_64
blktrace is a specialized utility for tracing block I/O events
Multiple event lines are printed for each I/O. You can also monitor disk IO by process. The columns are:
- Device major, minor number
- CPU ID
- Sequence number
- Action time, in seconds
- Process ID
- Action identifier (see blkparse(1)): Q == queued, G == get request, P == plug, M == merge, D == issued, C == completed, etc.
- RWBS description (see the “rwbs” section earlier in this chapter): W == write, S == synchronous, etc.
- Address + size [device]
# btrace /dev/sda
  8,3    3    50080    29.219400645 24545  A   W 86921600 + 128 <- (253,1) 85174656
  8,0    3    50081    29.219400796 24545  A   W 95783296 + 128 <- (8,3) 86921600
  8,0    3    50082    29.219400987 24545  Q   W 95783296 + 128 [kworker/u64:3]
  8,0    3    50083    29.219401336 24545  G   W 95783296 + 128 [kworker/u64:3]
  8,0    3    50084    29.219401617 24545  I   W 95783296 + 128 [kworker/u64:3]
  8,0    3    50085    29.219401811 24545  D   W 95783296 + 128 [kworker/u64:3]

<Output trimmed>
CPU0 (8,0):
 Reads Queued:         312,    9,460KiB  Writes Queued:       1,430,   91,400KiB
 Read Dispatches:      198,    9,460KiB  Write Dispatches:    1,430,   91,460KiB
 Reads Requeued:         0               Writes Requeued:         0
 Reads Completed:      198,    9,460KiB  Writes Completed:    1,430,   91,460KiB
 Read Merges:          114,    5,176KiB  Write Merges:            0,        0KiB
 Read depth:            34               Write depth:           255
 IO unplugs:           167               Timer unplugs:           0

<Output trimmed>

Throughput (R/W): 3,714KiB/s / 67,320KiB/s
Events (8,0): 227,220 entries
Skips: 0 forward (0 -   0.0%)
At the end of execution you will get a summary of disk statswith throughput details of read and write operations.
Perf
tools are performance analysis tools based on Linux
perf_events (aka perf) and ftrace.
9. perf-tools: iolatency
iolatency - summarize block device I/O latency as a histogram and is
part of perf-tools, you can download iolatency script from below
location
# wget https://raw.githubusercontent.com/brendangregg/perf-tools/master/iolatency
Provide executable permission to the downloaded script
# chmod u+x iolatency
Next execute the script with -Q option which enables queued time. The
-Q option includes the block I/O queued time, by tracing based on
block_rq_insert instead of block_rq_issue:
# ./iolatency -Q
Tracing block I/O. Output every 1 seconds. Ctrl-C to end.

  >=(ms) .. <(ms) : I/O |Distribution | 0 -> 1       : 32       |#                                     |
       1 -> 2       : 0        |                                      |
       2 -> 4       : 0        |                                      |
       4 -> 8       : 0        |                                      |
       8 -> 16      : 0        |                                      |
      16 -> 32      : 5605     |######################################|
      32 -> 64      : 156      |##                                    |
^C
Ending tracing...
Here the disk latency is between 16 - 32 milliseconds.
You can get some more examples on iolatency on the
official github page
10. perf-tools: iosnoop - monitor disk IO by process
iosnoop is another tool from perf-tools. You can
download iosnoop script
from the below path
# wget https://raw.githubusercontent.com/brendangregg/perf-tools/master/iosnoop
Provide executable permission to the downloaded script
# chmod u+x iosnoop
It will trace disk I/O with details including latency. Here using -p I
have provided the PID of cp command for which ionoop will show the
latency value to monitor disk IO by process ID.
# ./iosnoop -p $(pidof cp)
Tracing block I/O issued by PID 14823. Ctrl-C to end.
COMM         PID    TYPE DEV      BLOCK        BYTES     LATms
cp           8893   W    8,0      1214026496   524288    24.65
cp           8893   W    8,0      1214027520   524288    24.74
cp           8893   W    8,0      1214028544   524288    24.82
cp           8893   W    8,0      1214029568   524288    24.90
cp           8893   W    8,0      1214030592   524288    24.99
^C
Ending tracing...
For more examples and list of supported options you can check the official github page
11. BPF Tools
Traditional Performance tools provide some insight for storage I/O, including IOPS rates, average latency and queue lengths, and I/O by process.
BPF tracing tools can provide additional insight for disk stats and can be used for disk IO performance in Linux.
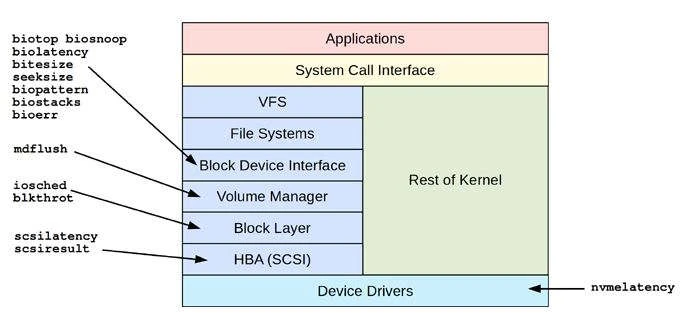
Credits: BPF Performance Tools
11.1 BPF Pre-requisite
You must install below rpms to be able to use BPF
- bcc
- bpftool
- bpftrace
Here bcc can be installed from the system repository. Make sure bcc
rpm version matches the loaded kernel version. So you can install both
rpms together
# yum install bcc kernel
Next install bpftools and bpftrace to be able to monitor disk IO
performance
# curl https://repos.baslab.org/bpftools.repo
This will download the repo file and place at
/etc/yum.repos.d/bpftools.repo. Now you can install bpftrace and
bpftools using yum
# yum install bpftool bpftrace
For more information to install bpftool and bpftrace
11.2 biolatency
biolatency is a BCC and bpftrace tool to show disk IO statistics
with latency as a histogram. The term device latency refers to the time
from issuing a request to the device, to when it completes, including
time spent queued in the operating system. We can use biolatency to
check disk stats and monitor disk IO performance.
The -D option in biolatency shows histograms for disks stats
separately, helping you see how each type performs.
# /usr/share/bcc/tools/biolatency -D
Tracing block device I/O... Hit Ctrl-C to end.
^C  <-- Press Ctrl+C after waiting for few seconds/minutes disk = 'sda' usecs : count distribution 0 -> 1          : 0        |                                        |
         2 -> 3          : 0        |                                        |
         4 -> 7          : 0        |                                        |
         8 -> 15         : 0        |                                        |
        16 -> 31         : 0        |                                        |
        32 -> 63         : 127      |                                        |
        64 -> 127        : 1101     |                                        |
       128 -> 255        : 3190     |**                                      |
       256 -> 511        : 3855     |**                                      |
       512 -> 1023       : 5222     |***                                     |
      1024 -> 2047       : 9027     |*****                                   |
      2048 -> 4095       : 23773    |***************                         |
      4096 -> 8191       : 1256     |                                        |
This output shows disk IO statistics for /dev/sda, an internal disk,
with I/O latency often between 128 and 4095 microseconds
11.3 biosnoop
biosnoop is a BCC and bpftrace tool that prints a one-line summary
for each disk IO statistics.
It prints a line of output for each disk IO statistics, with details
including latency (time from device issue to completion).
This allows you to examine disk IO performance in more detail:
# /usr/share/bcc/tools/biosnoop -Q
TIME(s)     COMM           PID    DISK    T SECTOR     BYTES  QUE(ms) LAT(ms)
0.000000    kworker/u64:1  4434   sda     W 708680704  65536     0.00  101.43
0.000097    kworker/u64:1  4434   sda     W 708680832  65536     0.00  101.52
0.000190    kworker/u64:1  4434   sda     W 708680960  65536     0.00  101.61
0.000252    kworker/u64:1  4434   sda     W 708681088  65536     0.00  101.66
0.000265    kworker/u64:1  4434   sda     W 708681216  65536     0.00  101.67
0.000285    kworker/u64:1  4434   sda     W 708681344  65536     0.00  101.68
The biosnoop columns are:
- TIME(s): I/O completion time in seconds
- COMM: Process name, if cached
- PID: Process ID, if cached
- DISK: Storage device name
- T: Type: R == reads, W == writes
- SECTOR: Address on disk in units of 512-byte sectors
- BYTES: Size of the I/O
- LAT(ms): Duration of the I/O from device issue to device completion
11.4 biotop
biotop is a BCC tool that is similar to top but to get disk stats
and disk IO statistics in Linux.
biotop [options] [interval [count]]
Options include:
- -C: Don’t clear the screen
- -r ROWS: Number of rows to print
# /usr/share/bcc/tools/biotop -C
Tracing... Output every 1 secs. Hit Ctrl-C to end

23:23:37 loadavg: 2.17 1.58 0.91 4/630 6711

PID    COMM             D MAJ MIN DISK       I/O  Kbytes  AVGms
5702   kworker/u64:2    W 8   0   sda       3285  210240   2.62
6120   kworker/u64:0    W 8   0   sda        486   31104  23.37
6709   cp               W 8   0   sda         18    9088  39.43
5702   kworker/u64:2    R 8   0   sda         36     144   1.48
Top of the list are kworker threads initiating writes: this is
background write flushing, and the real process that dirtied the pages
is not known at this point
11.5 bitesize
bitesize is a BCC and bpftrace tool to show the size of disk IO
statistics.
# /usr/share/bcc/tools/bitesize
Tracing block I/O... Hit Ctrl-C to end.
^C
Process Name = kworker/u65:0
     Kbytes              : count     distribution
         0 -> 1          : 8        |****************************************|

Process Name = jbd2/dm-3-8
     Kbytes              : count     distribution
         0 -> 1          : 6        |****************************************|
This output shows the disk stats that both the kworker thread and
jbd2 are calling I/O mostly in the 0 to 1 Kbyte range.
11.6 ext4slower
ext4slower traces the ext4 file system and checks
disk IO performance for ext4 file system, and then only prints those
disk stats that exceed a threshold.
Similar tools exist in bcc for other file systems: btrfsslower,
xfsslower, and zfsslower. There is also fileslower, which works at
the VFS layer and traces everything (although at some higher overhead).
# /usr/share/bcc/tools/ext4slower
Tracing ext4 operations slower than 10 ms
TIME     COMM           PID    T BYTES   OFF_KB   LAT(ms) FILENAME
16:55:38 dd             23317  W 512     319      18446744073708.55 dummy_file
Here I have a dd command running on another terminal to simulate
artificial disk IO statistics
Conclusion
In this tutorial we learned about various Linux tools which can be used to check disk usage by different processes and monitor disk IO Performance. Disk read write plays very important role in how application data is processed between RAM and Disk so it is very important that you have disk with good I/O speed and RPM. I would recommend reading about different available disk types and disk interface types
This would give you an idea on choosing the type of drive which suits your requirement. In production environment we mostly prefer HDD over SSD due to cost and many other factors but for laptops and desktops mostly SSD are used. But now a days even in production environment is starting to move to SSD to support cloud environment.
Lastly I hope the steps from the article to monitor disk IO performance, disk stats and disk IO statistics in Linux was helpful. So, let me know your suggestions and feedback using the comment section.
References
I have used below external references for this tutorial guide
BPF Performance Tools