
How to monitor network traffic in Linux? How to monitor application network traffic real time in Linux? How to perform speed test using command line in Linux? How to monitor network speed in graphical and CLI in Linux.
We will cover these questions in this tutorial. There are multiple open source and commercial software available to monitor network traffic. but I will concentrate on the tools which are delivered as part of Linux distribution rather than third party tools.
I will be using CentOS 8 for all the demonstrations where
192.168.43.154 (server.example.com) will act as server and
192.168.43.10(client.example.com) will act as a client. If you are on
a different distribution then some of the commands and their arguments
may vary.
Method 1: Check network bandwidth using iperf3
iperf3 is a tool for performing network throughput measurements. It
can test TCP, UDP, or SCTP throughput. To perform an iperf3 test the
user must establish both a server and a client.
You can use yum search to get the package name.
~]# yum search iperf
Last metadata expiration check: 1 day, 1:47:01 ago on Thu 17 Sep 2020 01:25:43 PM IST.
============================================ Name Matched: iperf ============================================
iperf3.i686 : Measurement tool for TCP/UDP bandwidth performance
iperf3.x86_64 : Measurement tool for TCP/UDP bandwidth performance
Install iperf3 on both the server and client node
[root@server ~]# yum install iperf3 -y
[root@client ~]# yum install iperf3 -y
On the node which will act as server I will enable port 5201 which is
the default port used by iperf3 using firewalld. The port used can
be changed with the-p command line option. I have intentionally not
used --permanent with firewalld as I just want to allow this port
for temporary session.
[root@server ~]# firewall-cmd --add-port=5201/tcp --zone=public
success
On the server system, iperf3 is told to listen for a client connection
using iperf3 -i 5 -s:
Here,
-ithe interval to provide periodic bandwidth updates-slisten as a server
Sample output from my server. Press Ctrl+C once the client stops
sending packets
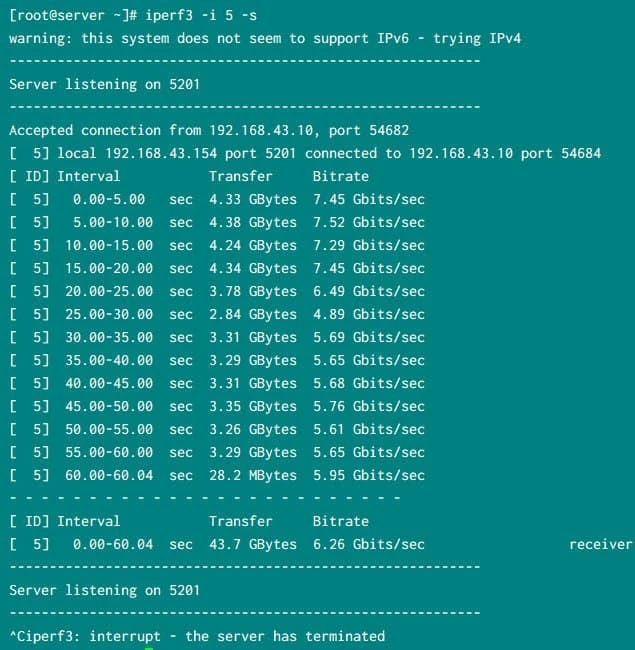
iperf3 running on server
On the client node execute
iperf3 -i 5 -t 60 -c <IP/hostname of the server>
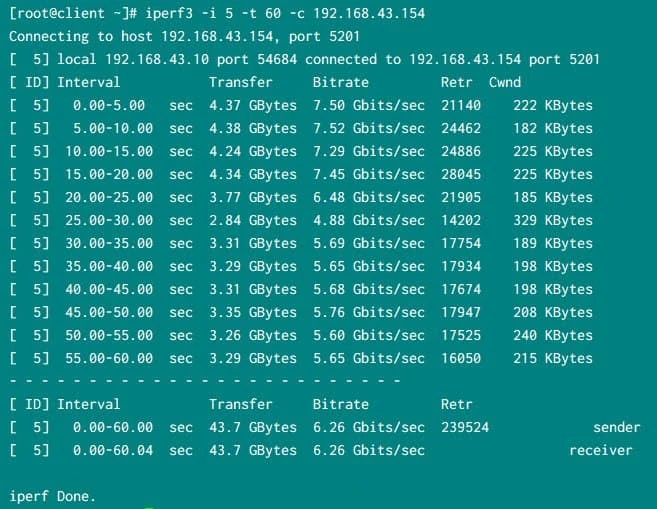
iperf3 session from the client
Here,
-ithe interval to provide periodic bandwidth updates-tthe time to run the test in seconds-cconnect to a listening server at…
So the network throughput between my server and client was
~6 GB/sec
Method 2: Network B/W and latency measurement using qperf
qperf is a network bandwidth and latency measurement tool which works
over many transports including TCP/IP, RDMA, UDP, and SCTP.It is
available in the RHEL and CentOS Server channel, so no third-party
packages are required.
Install qperf from the on both the server and client host:
[root@server ~]# yum install qperf -y
[root@client ~]# yum install qperf -y
The server listens on TCP Port 19765 by default. This can be changed
with the --listen_port option.
[root@server ~]# firewall-cmd  --add-port=19765/tcp --add-port=19766/tcp
success
As I don’t intend to use this port, I have not used --permanent so the
firewalld rule changes will not be persistent.
On server execute qperf to start receiving the packates
[root@server ~]# qperf
Simultaneously on the client execute below command to check for TCP
bandwidth. Here replace 192.168.43.154 with the IP or hostname of
your server where you started qperf
[root@client ~]# qperf -ip 19766 -t 60 --use_bits_per_sec 192.168.43.154 tcp_bw
Here,
-ipuse Port to run the socket tests-tset test duration to Time.--use_bits_per_secuse bits/sec rather than bytes/sec when displaying networking speed
Similarly we can check for TCP latency between server and client.
Here the latency is 83.1 microseconds and since we have used -v the
results are more detailed.
[root@client ~]# qperf -ip 19766 -t 60 --use_bits_per_sec 192.168.43.154 -vvs tcp_lat
Following is the result from my client node:
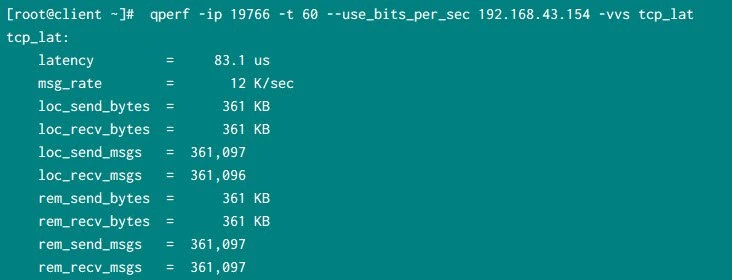
qperf to monitor network latency
Method 3: Using nc or netcat with dd command
dd is in the coreutils package, and nc is in the nc package,
both provided by Red Hat and CentOS default repository.
On the server enable the port which you will use to monitor the network
throughput. I will use port 12345 so I have enabled it temporarily
just for this session without using --permanent.
[root@server ~]# firewall-cmd --add-port=12345/tcp
success
Next start a netcat listener on the server.
[root@server ~]# nc -l -n 12345 > /dev/null
Simultaneously have the client connect to the listener using
dd if=/dev/zero bs=1M count=10240 | nc -n <server hostname or ip address> 12345.
The dd command will report throughput/second:
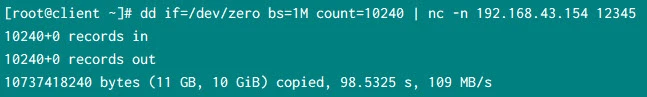
Monitor network throughput with dd and nc
netcat uses a smaller buffer than other tools and this buffer size
cannot be changed, this introduces a bottleneck in netcat, so
throughput will be significantly lower with netcat than with
purpose-built tools like iperf
Method 4: Monitor network bandwidth using shell script
There are multiple system tools which gives us the TX (transfer) and RX (receive) data for individual interfaces. We can easily monitor these values to get real time network bandwidth usage details.
Output from ifconfig for eth1 interface
~]# ifconfig eth1
eth1: flags=4163<UP,BROADCAST,RUNNING,MULTICAST>  mtu 1500
        inet 192.168.43.154  netmask 255.255.255.0  broadcast 192.168.43.255
        inet6 fe80::a00:27ff:fe95:c0e3  prefixlen 64  scopeid 0x20
        inet6 2401:4900:120d:cd6b:a00:27ff:fe95:c0e3  prefixlen 64  scopeid 0x0
        ether 08:00:27:95:c0:e3  txqueuelen 1000  (Ethernet)
        RX packets 3902476  bytes 85261651441 (79.4 GiB)
        RX errors 0  dropped 1  overruns 0  frame 1
        TX packets 2516956  bytes 168473567 (160.6 MiB)
        TX errors 0  dropped 0 overruns 0  carrier 0  collisions 0
Content of /proc/net/dev
 ~]# grep -E  'eth1|Inter' /proc/net/dev
Inter-|   Receive                                                |  Transmit
  eth1: 85261669043 3902679    0    1    0     1          0         0 168491603 2517170    0    0    0     0       0          0
Output from ip command
 ~]# ip -s link show eth1
3: eth1: <BROADCAST,MULTICAST,UP,LOWER_UP> mtu 1500 qdisc fq_codel state UP mode DEFAULT group default qlen 1000
    link/ether 08:00:27:95:c0:e3 brd ff:ff:ff:ff:ff:ff
    RX: bytes  packets  errors  dropped overrun mcast
    85261675055 3902749  0       1       0       0
    TX: bytes  packets  errors  dropped carrier collsns
    168497603  2517238  0       0       0       0
So as you see all these commands give you the data of overall
transferred and received bytes over the period of time from eth1
interface. We will use a custom script to monitor real time traffic
usage on eth1 interface by using these TX and RX bytes
Here I have written a shell script which does real time monitoring of individual interface on Linux server:
#!/bin/bash
# Script to monitor traffic on interface

# measurement interval in seconds
interval=2
mif=$1

ifconfig | grep $mif 2>/dev/null
if [ $? -ne 0 ] ; then
  echo "interface $mif not found"
  echo "usage: ./monitor_if <interface>"
  echo "e.g.: ./monitor_if bond2"
  exit
fi

pf="" # prefix
declare -i rpf=0 #prefix rate
frpf=0.0 #prefix rate float

function conf_pre {
   pf=""
   rpf=$1
   frpf=$1
   if [ $rpf -ge 1000 ] ; then
      frpf=$(echo "scale=2 ; $frpf/1000.0" | bc)
      rpf=$(( $rpf/1000 ))
      pf="K"
   fi
   if [ $rpf -ge 1000 ] ; then
      frpf=$(echo "scale=2 ; $frpf/1000.0" | bc)
      pf="M"
   fi
}

while true; do

   rx1=`ifconfig $mif | awk  '/RX.*bytes/ {print $5}'`
   tx1=`ifconfig $mif | awk  '/TX.*bytes/ {print $5}'`
   sleep $interval
   rx2=`ifconfig $mif | awk  '/RX.*bytes/ {print $5}'`
   tx2=`ifconfig $mif | awk  '/TX.*bytes/ {print $5}'`

   clear
   rx=$(( (($rx2-$rx1)/$interval)* 8 ))
   tx=$(( (($tx2-$tx1)/$interval)* 8 ))

   date
   echo -n "traffic RX : "
   conf_pre $rx
   echo "${frpf}${pf}bps"
   echo -n "traffic TX : "
   conf_pre $tx
   echo "${frpf}${pf}bps"
done
We have to execute this shell script with the interface we want to monitor:
 ~]# /tmp/monitor_nic.sh eth1
eth1: flags=4163<UP,BROADCAST,RUNNING,MULTICAST>  mtu 1500

Fri Sep 18 21:47:25 IST 2020
traffic RX : 1230.01Mbps
traffic TX : 819.57Kbps
The screen will refresh every 2 second and you will get the real time
network bandwidth usage on the provided interface.
Method 5: Monitor network traffic using sar
saris a short term abbreviation for System Activity Report.- It can be used for realtime monitoring of Linux system performance.
- The
sarcommand writes to standard output based on the values in the count and interval parameters - The collected data can also be saved in the file specified by the -o filename flag, in addition to being displayed onto the screen.
- You can select information about specific system activities using flags. Not specifying any flags selects only CPU activity.
- The
sarcommand extracts and writes to standard output records previously saved in a file. This file can be either the one specified by the-fflag. - All data is captured in binary form and saved to a file (datafile)
with default location
/var/log/sa/saXXwhereXXspecified the day of the month
sar is provided as part of sysstat package. This package may not be
installed by default so you can install it manually:
~]# yum -y install sysstat
The syntax to be used to monitor real time network traffic per interface:
# sar -n DEV [interval] [count]
In this example we are executing sar for 10 times with an interval of
2 seconds. This gives a real time information of packets sent and
received per interface. You can check
man page of sar to understand about
individual section
~]# sar -n DEV 2 10
Linux 4.18.0-193.14.2.el8_2.x86_64 (server.example.com)         09/18/2020      _x86_64_        (1 CPU)

09:52:16 PM     IFACE   rxpck/s   txpck/s    rxkB/s    txkB/s   rxcmp/s   txcmp/s  rxmcst/s   %ifutil
09:52:18 PM      eth1      1.50      1.50      0.11      0.12      0.00      0.00      0.00      0.00
09:52:18 PM    virbr0      0.00      0.00      0.00      0.00      0.00      0.00      0.00      0.00
09:52:18 PM      eth0      0.50      0.50      0.03      0.35      0.00      0.00      0.00      0.00
09:52:18 PM        lo      0.00      0.00      0.00      0.00      0.00      0.00      0.00      0.00
09:52:18 PM virbr0-nic     0.00      0.00      0.00      0.00      0.00      0.00      0.00      0.00

<Output trimmed>

Average:        IFACE   rxpck/s   txpck/s    rxkB/s    txkB/s   rxcmp/s   txcmp/s  rxmcst/s   %ifutil
Average:         eth1   2154.42   1015.83  99623.28     65.86      0.00      0.00      0.00      0.00
Average:       virbr0      0.00      0.00      0.00      0.00      0.00      0.00      0.00      0.00
Average:         eth0      0.67      0.67      0.04      0.29      0.00      0.00      0.00      0.00
Average:           lo      0.00      0.00      0.00      0.00      0.00      0.00      0.00      0.00
Average:    virbr0-nic     0.00      0.00      0.00      0.00      0.00      0.00      0.00      0.00
You can read more about sar and many other options supported to monitor different types of system resources (in CLI and GUI)
What’s Next
Now since you are familiar with network bandwidth, you may want to learn
more monitoring other
system resources such as CPU and Memory
Shell
script to check top memory & cpu consuming process in Linux
5 useful
tools to detect memory leaks with examples
How to check
memory usage per process in Linux
Conclusion
In this tutorial I have shared a list of tools and commands which can be used to monitor network traffic for individual or all the interfaces in Linux. I have tried to use only those tools which are delivered as part of default RHEL/CentOS repository and you don’t need to download or install any rpm from third party sources. The default system itself contains so many useful command for network diagnostics, although when you need more details such as historical data of network consumed by individual process then we may have to rely on third party tools.
Lastly I hope the steps from the article to monitor network traffic on Linux was helpful. So, let me know your suggestions and feedback using the comment section.
References
I have used below external references for this tutorial guide
How to
test network bandwidth using system provided tools