![15+ iostat command examples in Linux [Cheat Sheet]](/iostat-command-in-linux/iostat_command.jpg)
Introduction to iostat command
iostat is a command-line utility in a Linux system to monitor CPU statistics and input/output statistics for devices, partitions, and network filesystems (NFS). It monitors system input/output device loading by observing the time the devices are active to their average transfer rates. iostat command generates reports that can help to change system configuration to balance the input/output load between physical disks efficiently.
Reports of iostat command
Theiostat command creates three types of reports.
- CPU Utilization report
- Device Utilization report
- Network Filesystem report
/proc filesystem must be mounted for iostat to work. iostat uses the following files to generate the reports.
- /proc/statcontains system statistics.
- /proc/uptimecontains system uptime.
- /proc/partitions contains disk statistics.
- /proc/diskstats contains disks statistics.
- /sys contains statistics for block devices.
- /proc/self/mountstatscontains statistics for network filesystems.
How to install iostat in Linux
If iostat is not already installed in the system, you can use the following command to install it.
Install iostat on CentOS, Fedora and RHEL
$ sudo yum install sysstat
Install iostat on Ubuntu, Debian, and Linux Mint
$ sudo apt install sysstat
Different examples to use iostat command
After the iostat is installed, you can run its command in the terminal.
The general syntax of iostat command is:
$ iostat [OPTION]
Some available options are:
- -c: Display the CPU utilization report only
- -d: Display the device utilization report only
- -k: Display statistics in kilobytes per second
- -m: Display statistics in megabytes per second
- -x: Display extended statistics
1. iostat command to display report for all CPU and devices
When used without any option, iostat command displays the report for all CPU and devices utilization.
$ iostat
Sample Output:
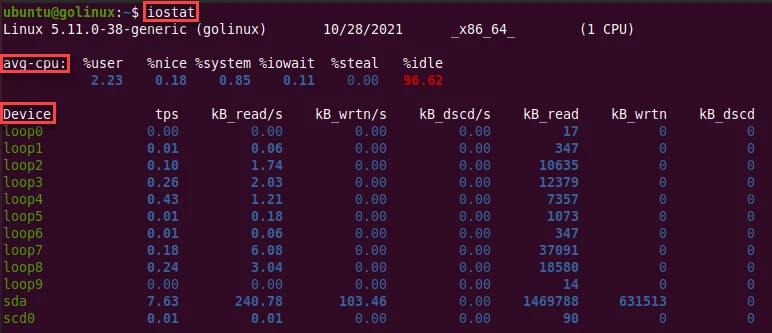
The first report generated by the iostat is the CPU Utilization Report. It contains statistics for the time since system startup (boot).
- %user - It shows the percentage of CPU utilization while executing at the user level (application).
- %nice - It shows the percentage of CPU utilization that occurred while executing at the user level with nice priority.
- %system - It shows the percentage of CPU utilization that occurred while executing at the system level (kernel).
- %iowait - It shows the percentage of time that the CPU or CPUs were idle during which the system had an outstanding disk I/O request.
- %steal - It contains the percentage of time spent in involuntary wait by the virtual CPU or CPUs while the hypervisor was servicing another virtual processor.
- %idle - It shows the percentage of time that the CPU or CPUs were idle and the system did not have an outstanding disk I/O request.
The second report generated by the iostat is the Device Utilization Report. The device report provides statistics on a per physical device or partition basis.
Device - It contains the device or partition name.
- tps - It indicates the number of transfers per second that were issued to the device.
- Blk_read/s (kB_read/s, MB_read/s) - It is the amount of data read from the device expressed in blocks (kilobytes, megabytes) per second.
- Blk_wrtn/s (kB_read/s, MB_read/s) - It shows the amount of data written to the device expressed in blocks (kilobytes, megabytes) per second.
- Blk_read (kB_read, MB_read) - The total number of blocks (kilobytes, megabytes) read.
- Blk_wrtn (kB_read, MB_read)- The total number of blocks (kilobytes, megabytes) written.
2. iostat command to display the CPU utilization report
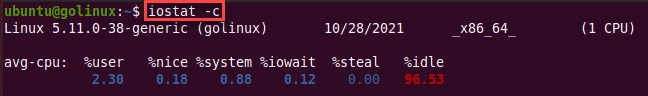
-c option can be used to display only the CPU utilization report.
$ iostat -c
Sample Output:
3. Display continuous CPU utilization report at N seconds interval
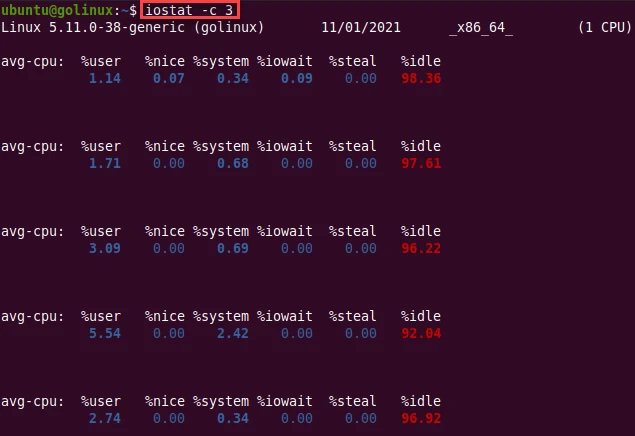
If we specify N number after iostat command, it displays the report every N seconds continuously.
$ iostat -c N
Sample Output:
To display continuous CPU utilization reports at three second intervals, you can use:
4. iostat command to display the device utilization report
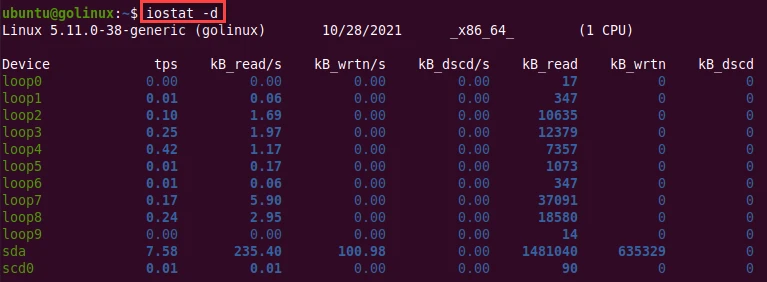
-d option shows the device utilization report only. The device report
contains statistics for every device used by the system.
$ iostat -d
Sample Output:
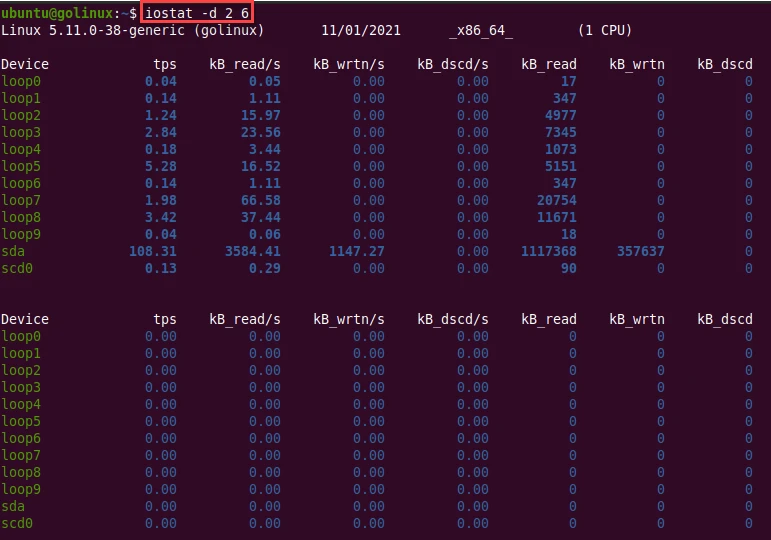
5. iostat command to display M reports at N second interval
You can use the following syntax to display M number of reports at N second interval.
$ iostat N M
Sample Output:
For example, to display six device utilization reports at two second intervals, you can use the following command.
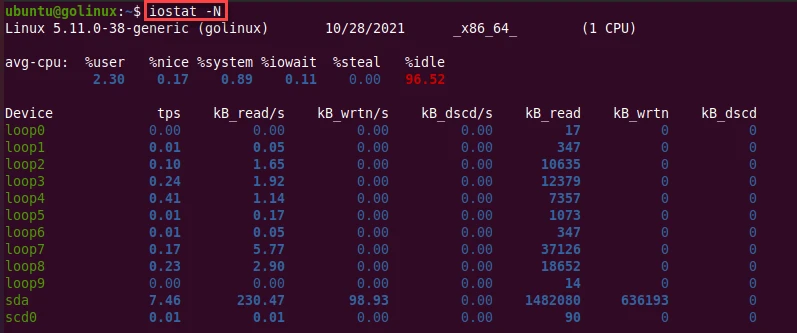
6. Display the registered device mapper names with iostat command
-N option displays the registered device mapper names for any device
mapper devices. It is useful for viewing LVM2 statistics.
$ iostat -N
Sample Output:
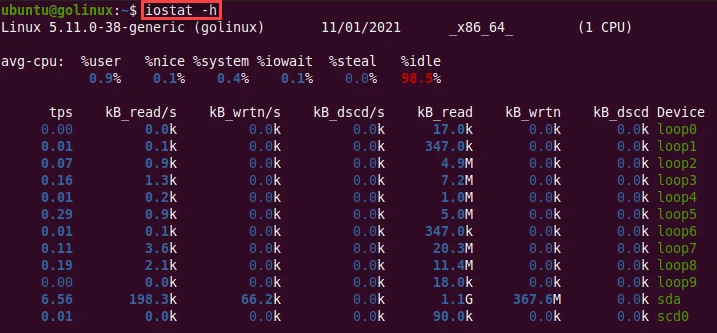
7. Display the report in human-readable format
-h option helps to make the device utilization report easier to read
by a human by showing the amount of data in kilobytes, megabytes, and
gigabytes.
$ iostat -h
Sample Output:
8. iostat command to display the extended statistics
You can extend the statistics displayed by iostat using -x option. It
extends the report of devices only.
$ iostat -x
Sample Output:
# iostat -x
Linux 5.4.0-80-generic (ubuntu)         03/11/21        _x86_64_        (1 CPU)

avg-cpu:  %user   %nice %system %iowait  %steal   %idle
           6.21    0.42    3.19    0.72    0.00   89.47

Device            r/s     rkB/s   rrqm/s  %rrqm r_await rareq-sz     w/s     wkB/s   wrqm/s  %wrqm w_await wareq-sz     d/s     dkB/s   drqm/s  %drqm d_await dareq-sz  aqu-sz  %util
dm-0            79.75   3004.74     0.00   0.00    2.22    37.68   19.78    278.38     0.00   0.00    0.39    14.07    0.00      0.00     0.00   0.00    0.00     0.00    0.18   9.53
dm-1             0.29      7.12     0.00   0.00    0.11    24.16    0.00      0.00     0.00   0.00    0.00     0.00    0.00      0.00     0.00   0.00    0.00     0.00    0.00   0.02
loop0            0.01      0.01     0.00   0.00    0.00     1.00    0.00      0.00     0.00   0.00    0.00     0.00    0.00      0.00     0.00   0.00    0.00     0.00    0.00   0.00
loop1           19.85     21.51     0.00   0.00    1.40     1.08    0.00      0.00     0.00   0.00    0.00     0.00    0.00      0.00     0.00   0.00    0.00     0.00    0.02   0.34
loop10           0.21      1.85     0.00   0.00    0.31     8.78    0.00      0.00     0.00   0.00    0.00     0.00    0.00      0.00     0.00   0.00    0.00     0.00    0.00   0.02
loop11           0.18      1.82     0.00   0.00    0.13    10.20    0.00      0.00     0.00   0.00    0.00     0.00    0.00      0.00     0.00   0.00    0.00     0.00    0.00   0.01
loop12           0.08      0.20     0.00   0.00    0.13     2.63    0.00      0.00     0.00   0.00    0.00     0.00    0.00      0.00     0.00   0.00    0.00     0.00    0.00   0.01
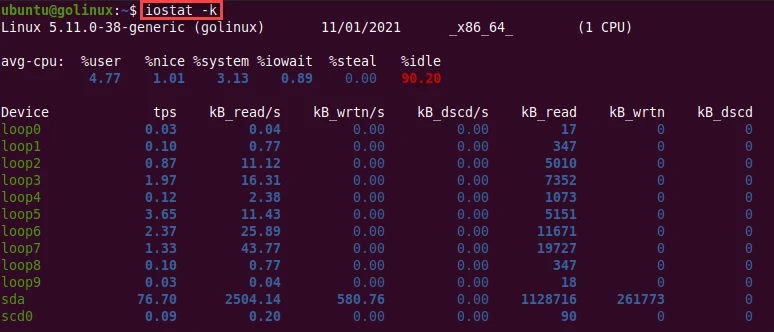
9. Display statistics in kilobytes per second
-k option helps to display statistics in kilobytes per second.
$ iostat -k
Sample Output:
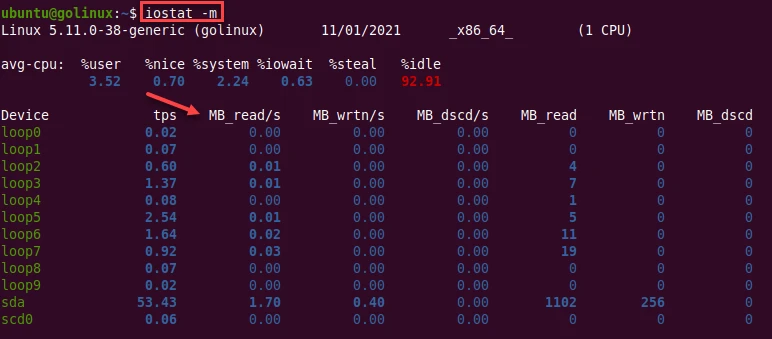
10. Display statistics in megabytes per second with iostat command
You can use -m option to display statistics in megabytes per second
instead of kilobytes per second.
$ iostat -m
Sample Output:
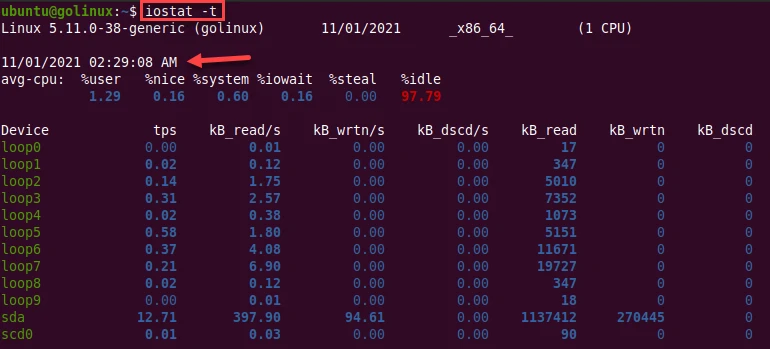
11. iostat command to display the timestamp for each report
-t option can be used to print the time for each report displayed.
$ iostat -t
Sample Output:
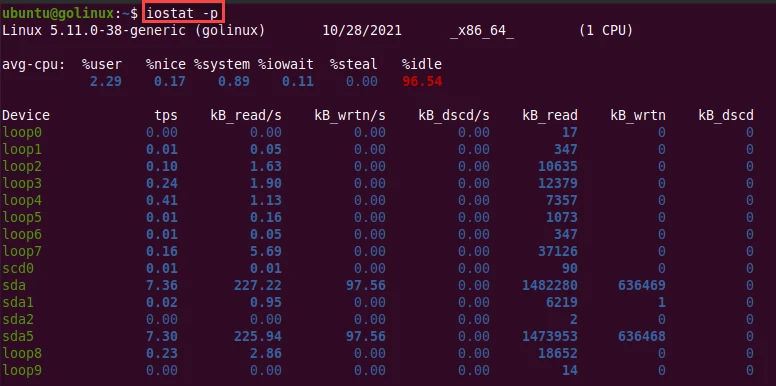
12. Displays report for block devices and all their partitions using iostat command
The -p option displays statistics for block devices and all their
partitions that are used by the system.
$ iostat -p
Sample Output:
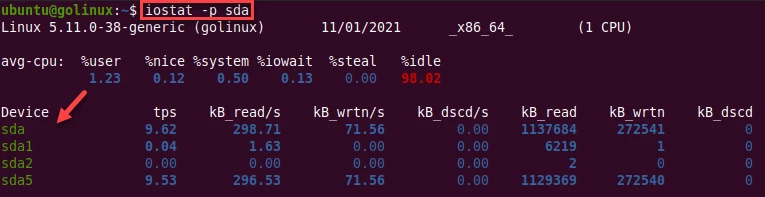
13. iostat command to display statistics for a specific device and its partitions
If we enter a device name after -p option, then statistics for it and
all its partitions are displayed.
$ iostat -p device_name
Sample Output:
You can also use ALL after -p option. It means that statistics
have to be displayed for all the block devices and partitions defined by
the system, including those that have never been used.
$ iostat -p ALL
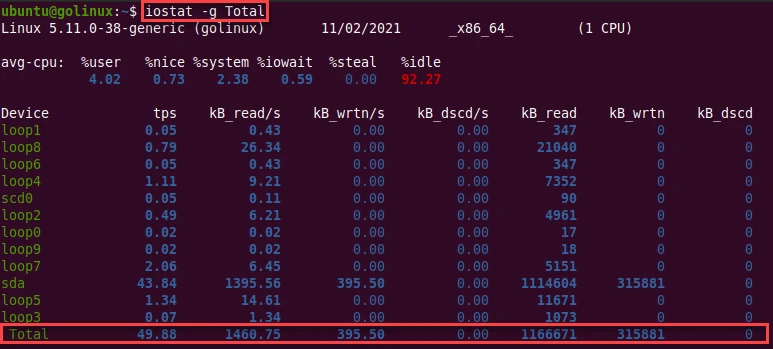
14. Display statistics for a group of devices
-g option tells iostat to add a line of global statistics as
group_name which contains the total statistics from all devices in the
list.
$ iostat -g group_name
Sample Output:
Here, we have given group_name as Total.
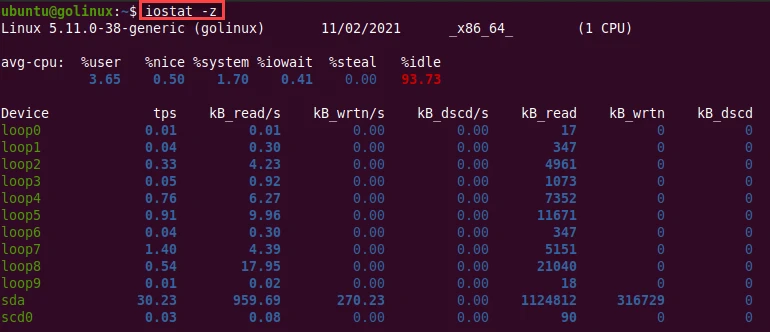
15. iostat command to display output for any devices
-z option helps to display output for any devices for which there was
no activity during the sample period.
$ iostat -z
Sample Output:
16. Display the iostat command output in JSON format
We can use -o JSON argument along with iostat command to display the
output in JSON format.
For example, here I am collecting CPU usage and printing the same output in JSPN format
# iostat -c -o JSON
{"sysstat": {
        "hosts": [
                {
                        "nodename": "ubuntu",
                        "sysname": "Linux",
                        "release": "5.4.0-80-generic",
                        "machine": "x86_64",
                        "number-of-cpus": 1,
                        "date": "03/11/21",
                        "statistics": [
                                {
                                        "avg-cpu":  {"user": 16.46, "nice": 1.48, "system": 9.80, "iowait": 1.40, "steal": 0.00, "idle": 70.86}
                                }
                        ]
                }
        ]
}}
17. Reduce the width of the iostat command output
By default the iostat command in some cases can take up the whole screen width and it may also go beyond the width of your terminal screen. In such case you can use -s argument to display a short (narrow) version of the report that should fit in 80 characters wide screens.
For example:
The default output for block device statistics would look like below:
# iostat -p
Linux 5.4.0-80-generic (ubuntu)         03/11/21        _x86_64_        (1 CPU)

avg-cpu:  %user   %nice %system %iowait  %steal   %idle
           7.20    0.49    3.71    0.84    0.00   87.77

Device             tps    kB_read/s    kB_wrtn/s    kB_dscd/s    kB_read    kB_wrtn    kB_dscd
loop0             0.01         0.01         0.00         0.00          4          0          0
loop1            22.65        24.54         0.00         0.00      13138          0          0
loop2             0.18         2.06         0.00         0.00       1104          0          0
loop3             0.39         0.95         0.00         0.00        506          0          0
loop4             0.40         0.95         0.00         0.00        507          0          0
We can reduce the width of this output by also using -s argument as
shown below:
# iostat -p -s
Linux 5.4.0-80-generic (ubuntu)         03/11/21        _x86_64_        (1 CPU)

avg-cpu:  %user   %nice %system %iowait  %steal   %idle
           7.25    0.49    3.73    0.84    0.00   87.68

Device             tps    kB_read/s     kB_w+d/s    kB_read     kB_w+d
loop0             0.01         0.01         0.00          4          0
loop1            22.80        24.71         0.00      13138          0
loop2             0.19         2.08         0.00       1104          0
loop3             0.40         0.95         0.00        506          0
18. Display statistics for specific disk partition
We can combine -p argument with the device name to display statistics
for the respective device along with it’s partitions.
For example, to display disk usage report for sda device we can
execute:
# iostat sda
Linux 5.4.0-80-generic (ubuntu)         03/11/21        _x86_64_        (1 CPU)

avg-cpu:  %user   %nice %system %iowait  %steal   %idle
           4.98    0.53    2.13    0.48    0.00   91.88

Device             tps    kB_read/s    kB_wrtn/s    kB_dscd/s    kB_read    kB_wrtn    kB_dscd
sda              43.76      2015.55       434.92         0.00    1995653     430623          0
To display statistics for sda and all it’s partitions we can use:
# iostat -p sda
Linux 5.4.0-80-generic (ubuntu)         03/11/21        _x86_64_        (1 CPU)

avg-cpu:  %user   %nice %system %iowait  %steal   %idle
           5.45    0.58    2.33    0.52    0.00   91.11

Device             tps    kB_read/s    kB_wrtn/s    kB_dscd/s    kB_read    kB_wrtn    kB_dscd
sda              47.55      2194.93       473.00         0.00    1995653     430058          0
sda1             46.94      2192.66       473.00         0.00    1993585     430058          0
Conclusion
iostat is a useful command which reports CPU statistics and input/output statistics for devices. We hope you have learned to use iostat command from this article. If you still have any confusion, ask us in the comment section.
What’s Next
Top 15 tools to monitor disk IO performance with examples