![How to make circular color gradient in Python? [SOLVED]](/how-to-make-circular-color-gradient-in-python/create-circular-color-gradient.jpg)
Different methods to create circular color gradient in Python
A color gradient is a way to smoothly transition between two or more colors. A circular gradient is a type of color gradient that transitions in a circular pattern, typically starting with one color at the center and gradually transitioning to other colors as you move outward.
There are several ways to create a circular color gradient in Python, some of the most common methods include:
- Using the
matplotlib.colors.LinearSegmentedColormapclass: This is a method that I explained in my previous answer, it uses a list of colors to create a colormap and numpy to calculate the distance from the center of the grid to each point in the grid. This distance is then used as the input for the colormap. - Using the
matplotlib.colors.ListedColormapclass: This method uses a discrete set of colors to create the gradient, it could be useful when you have a fixed number of colors. - Using a polar coordinate system and a color map: This method uses a polar coordinate system to create the circular gradient, and a color map to map the values of the coordinates to colors.
- Using the
PILlibrary: You can use theImageDraw.pieslice()method of thePILlibrary to create a circular gradient by filling a pie-shaped area with a gradient.
Pre-requisite - Install matplotlib module
We are going to be using matplotlib module in most of our examples but
it is not part of Python’s built-in default library and hence must be
installed separately. I am using Python3.9 in my environment so I
will use pip3 to install this module:
# pip3 install matplotlib
Collecting matplotlib
  Downloading matplotlib-3.6.3-cp39-cp39-manylinux_2_17_x86_64.manylinux2014_x86_64.whl (11.8 MB)
     |████████████████████████████████| 11.8 MB 7.3 MB/s
Collecting contourpy>=1.0.1
  Downloading contourpy-1.0.7-cp39-cp39-manylinux_2_17_x86_64.manylinux2014_x86_64.whl (299 kB)
     |████████████████████████████████| 299 kB 4.6 MB/s
Collecting pillow>=6.2.0
  Downloading Pillow-9.4.0-cp39-cp39-manylinux_2_28_x86_64.whl (3.4 MB)
     |████████████████████████████████| 3.4 MB 3.9 MB/s
Collecting kiwisolver>=1.0.1
  Downloading kiwisolver-1.4.4-cp39-cp39-manylinux_2_12_x86_64.manylinux2010_x86_64.whl (1.6 MB)
     |████████████████████████████████| 1.6 MB 2.5 MB/s
Requirement already satisfied: pyparsing>=2.2.1 in /usr/local/lib/python3.9/site-packages (from matplotlib) (2.4.7)
Collecting packaging>=20.0
  Downloading packaging-23.0-py3-none-any.whl (42 kB)
     |████████████████████████████████| 42 kB 469 kB/s
Requirement already satisfied: python-dateutil>=2.7 in /usr/lib/python3.9/site-packages (from matplotlib) (2.8.1)
Requirement already satisfied: numpy>=1.19 in /usr/local/lib64/python3.9/site-packages (from matplotlib) (1.24.1)
Collecting fonttools>=4.22.0
  Downloading fonttools-4.38.0-py3-none-any.whl (965 kB)
     |████████████████████████████████| 965 kB 2.2 MB/s
Collecting cycler>=0.10
  Downloading cycler-0.11.0-py3-none-any.whl (6.4 kB)
Requirement already satisfied: six>=1.5 in /usr/lib/python3.9/site-packages (from python-dateutil>=2.7->matplotlib) (1.15.0)
Installing collected packages: pillow, packaging, kiwisolver, fonttools, cycler, contourpy, matplotlib
Successfully installed contourpy-1.0.7 cycler-0.11.0 fonttools-4.38.0 kiwisolver-1.4.4 matplotlib-3.6.3 packaging-23.0 pillow-9.4.0
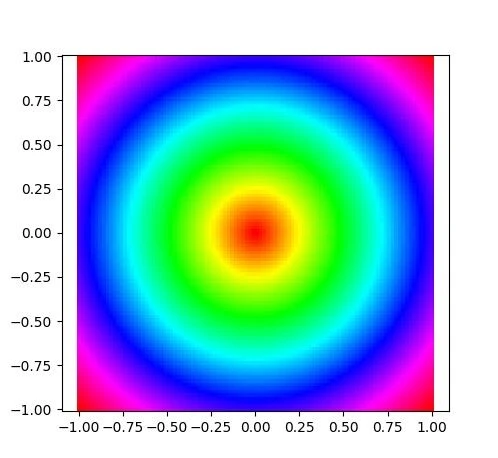
Example-1: Using matplotlib.colors.LinearSegmentedColormap class
Here is an example of how to create a circular color gradient using the
matplotlib.colors.LinearSegmentedColormap class:
import numpy as np
import matplotlib.pyplot as plt
from matplotlib.colors import LinearSegmentedColormap

# define color map
colors = [(1, 0, 0), (1, 1, 0), (0, 1, 0), (0, 1, 1), (0, 0, 1), (1, 0, 1), (1, 0, 0)]
cmap = LinearSegmentedColormap.from_list("my_cmap", colors)

# create color map
X, Y = np.meshgrid(np.linspace(-1,1,100), np.linspace(-1,1,100))
R = np.sqrt(X**2 + Y**2)

# plot color map
plt.figure(figsize=(5,5))
plt.pcolormesh(X, Y, R, cmap=cmap)
plt.axis("equal")
plt.show()
print("Circular gradient created")
In this example, the colors list defines a sequence of RGB tuples that
represent the colors in the gradient. The
LinearSegmentedColormap.from_list() method is used to create a
colormap from this list of colors.
The numpy function meshgrid is used to create a grid of coordinates,
and the numpy function sqrt is used to calculate the distance from
the center of the grid to each point in the grid. This distance is then
used as the input for the colormap.
Finally, the plt.pcolormesh method is used to plot the color map, and
the plt.axis method is used to make sure that the aspect ratio of the
plot is equal.
This code will create a circular color gradient with the defined colors,
if you want to change the colors, you can change the colors
tuple.
And you can adjust the size of the plot by changing the figsize
parameter in plt.figure().
Output:
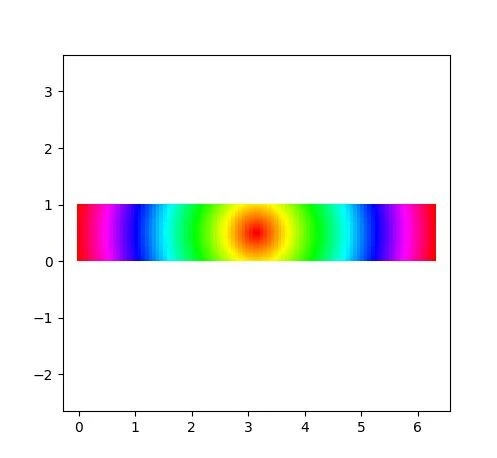
Example-2: Using matplotlib.colors.ListedColormap class
Here is an example of how to create a circular color gradient using the
matplotlib.colors.ListedColormap class:
import matplotlib.colors as mcolors
import matplotlib.pyplot as plt
import numpy as np

# Define the color map
colors = [(1, 0, 0), (1, 1, 0), (0, 1, 0), (0, 1, 1), (0, 0, 1), (1, 0, 1), (1, 0, 0)]
cmap = mcolors.LinearSegmentedColormap.from_list("my_cmap", colors)

# Create a polar grid
r = np.linspace(0, 1, 100)
theta = np.linspace(0, 2*np.pi, 100)
R, Theta = np.meshgrid(r, theta)

# Calculate the distance from the center of the grid to each point
distance = np.sqrt((R - 0.5)**2 + (Theta - np.pi)**2)

# Plot the color map
plt.figure(figsize=(5,5))
plt.pcolormesh(Theta, R, distance, cmap=cmap)
plt.axis("equal")
plt.show()
Here we define colors list, which contains a sequence of RGB tuples
that represent the colors in the gradient. The
LinearSegmentedColormap.from_list() method is used to create a
colormap from this list of colors.
Then, numpy functions linspace and meshgrid are used to create a
polar grid of coordinates. The coordinates are given by the polar angle
theta and the distance from the origin r.
Then, using these polar coordinates, the distance between each point in
the grid and the center of the grid is calculated using the
numpy.sqrt((R - 0.5)**2 + (Theta - np.pi)**2) expression. This
distance is used as the input for the colormap.
Finally, the plt.pcolormesh method is used to plot the color map, and
the plt.axis method is used to make sure that the aspect ratio of the
plot is equal.
This will create a circular color gradient in a polar coordinate system.
You can adjust the number of points in the grid by changing the
parameters of the linspace function, and you can change the colors by
modifying the colors list.
Output:
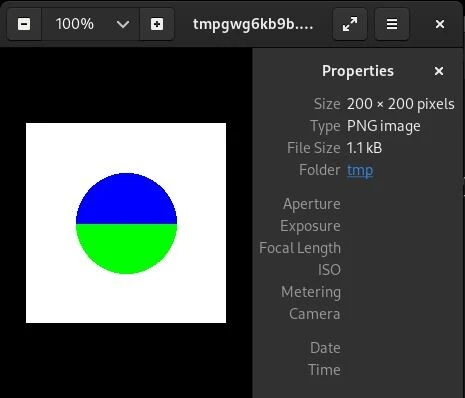
Example-3: Using ImageDraw.pieslice() method
Here is an example of how to create a circular color gradient using the
ImageDraw.pieslice() method of the PIL library:
from PIL import Image, ImageDraw

# Create an image
im = Image.new("RGB", (200,200), "white")

# Create a draw object
draw = ImageDraw.Draw(im)

# Define the color stops
color_stops = [(0, (255, 0, 0)), (0.5, (0, 255, 0)), (1, (0, 0, 255))]

# Draw the pie slice
for i, color_stop in enumerate(color_stops):
    if i == 0:
        start = 0
    else:
        start = color_stops[i-1][0]
    end = color_stop[0]
    draw.pieslice([50, 50, 150, 150], start*360, end*360, fill=color_stop[1])

# Show the image
im.show()
print("Circular gradient created")
In this example, an image of size 200x200 is created using the
Image.new() method. Then, a draw object is created using the
ImageDraw.Draw() method.
Then, I define the color stops, a list of tuples where each tuple represents a color and a position in the gradient (from 0 to 1), this is similar to the css linear gradient.
Then, the ImageDraw.pieslice() method is used to draw a pie-shaped
area with a gradient, it takes four parameters that define the bounding
box of the pie slice, and two angles that define the start and end of
the slice in degrees. The fill parameter is used to specify the color
of the slice. The method is called multiple times to draw the different
slices, each slice representing a color stop.
Finally, im.show() is used to display the image.
This will create a circular color gradient with the defined color stops.
You can adjust the size of the image by changing the parameters of the
Image.new() method and you can adjust the position and colors of the
color stops by modifying the color_stops list.
Output:
Summary
Matplotlib is a multiplatform data visualization library built on NumPy
arrays, and designed to work with the broader SciPy stack. We used the
matplotlib.colors.LinearSegmentedColormap class to create a colormap
from a list of colors and numpy to create a grid of coordinates, and
the numpy function sqrt is used to calculate the distance from the
center of the grid to each point in the grid.
The matplotlib.colors.CircularSegmentedColormap class is similar to
the LinearSegmentedColormap, but it uses polar coordinates instead of
cartesian coordinates to create the color gradient.
References
matplotlib.colors.LinearSegmentedColormap
matplotlib.colors.LinearSegmentedColormap
Plot circular gradients
using numpy